%20{%20.cls-1%20{%20fill:%20%23fff;%20}%20}%20%3c/style%3e%3c/defs%3e%3cg%20id='Layer_1-1'%20data-name='Layer%201'%3e%3cg%20id='Layer_1-1'%20data-name='Layer%201-1'%3e%3cpath%20class='cls-1'%20d='m220.77,35.74c2.97,0,3.62,1.09,3.41,3.84-1.09,18.77-14.64,37.69-32.18,43.57-5.87,1.96-12.32,2.83-18.48,3.12-12.61.43-25.23.14-37.84.14-1.59,0-3.19.07-4.71.29-6.09.94-10.22,5.65-10.08,11.53.14,5.87,4.78,10.8,10.87,11.09,5.94.29,11.96-.07,17.9.22,13.77.72,23.78,7.54,29,20.59,8.12,20.22-6.6,42.7-27.98,43.06-11.24.14-22.54.07-33.78.07-8.41,0-10.73,1.88-12.69,10.15-.94,3.77-1.74,7.61-3.04,11.31-6.02,17.11-17.9,27.18-35.59,29.07-9.64,1.01-19.5.14-29.79.14,2.25-10,4.35-19.5,6.52-29,1.88-8.19,3.84-16.31,5.58-24.5,3.26-15.01,13.48-23.7,28.49-23.85,13.77-.14,27.47-.07,41.25-.22,5.44-.07,9.64-3.19,11.09-7.97,1.38-4.35-.07-9.79-3.99-12.25-2.1-1.3-4.78-1.96-7.25-2.32-7.83-1.09-15.87-.94-23.41-2.97-19.21-5-31.53-22.54-30.95-42.48.58-19.93,14.35-37.11,33.27-41.46,3.26-.72,6.67-1.09,10-1.09l114.39-.07h0Z'/%3e%3c/g%3e%3c/g%3e%3c/svg%3e)
· Fabian Schreuder · Data Science Projects · 6 min read
Unlocking Retail Insights: Analyzing SPAR Promotions with Big Data
Discover how a custom big data system helps SPAR analyze promotional effectiveness, basket size, and cannibalization effects using Apache Spark and advanced analytics.
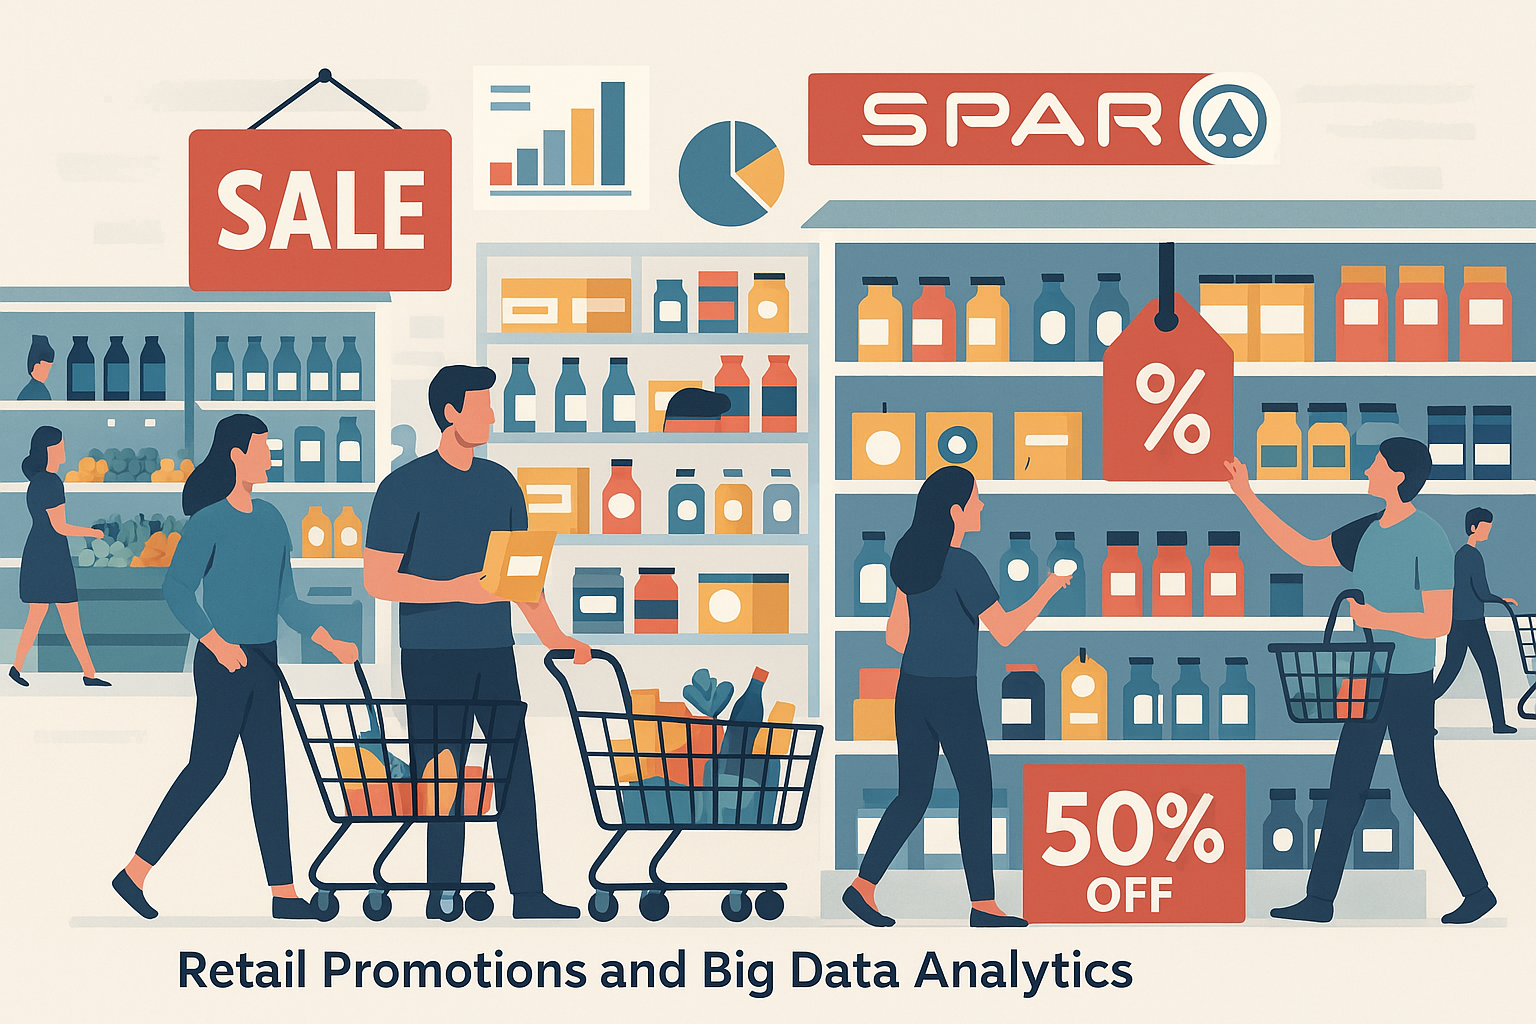
Retail promotions are a powerful tool. For global chains like SPAR, with millions of daily customers across thousands of stores (including over 483 in the Netherlands alone), promotions can drive 10-40% of total revenue. But understanding which promotions truly work, and why, is a complex challenge. Do they increase overall sales? Do they just shift purchases from one product to another (the “cannibalization effect”)? Do they encourage larger shopping trips (bigger “basket size”)?
To answer these questions for SPAR, we embarked on a project to build a big data analytics system capable of processing and analyzing vast amounts of transactional data.
The Big Data Challenge in Retail
SPAR’s data exemplifies the classic characteristics of big data:
- Volume: Over 792,000 transactions in just three weeks, scaling up to nearly 70 million records across 15 weeks for analysis.
- Velocity: Data continuously generated from hundreds of stores.
- Variety: Structured transaction details combined with potential for external data sources.
Handling this scale requires more than traditional tools. We needed a distributed system that could efficiently process, clean, and analyze this information to provide actionable insights.
Building the SPAR Data Analytics Solution
Our goal was to create a system that could provide both descriptive insights (what happened?) and predictive capabilities (what might happen?).
System Architecture: Lambda-Inspired
We opted for an adaptation of the Lambda architecture, focusing on its strengths in fault tolerance, scalability, and relatively low maintenance – crucial for handling large datasets efficiently.
- Batch Layer: The powerhouse of the system. It processes large volumes of immutable transaction data, creating comprehensive master datasets. Its immutable nature ensures data integrity and allows recomputation if needed.
- Serving Layer: Stores precomputed views derived from the batch layer (e.g., views per product subcategory, views per transaction). This allows for fast querying and analysis without reprocessing the entire dataset each time.
We intentionally omitted a Speed Layer (for real-time processing) to keep the system streamlined and focused on SPAR’s primary need for batch-based and ad-hoc analysis of historical trends.
Implementation Highlights: Spark and Data Processing
We leveraged Apache Spark for its powerful distributed processing capabilities, essential for handling the sheer volume of data.
- Data Loading: Efficiently loaded data from multiple weekly CSV files, inferring the schema from a sample to speed up the process and defining it explicitly to ensure consistency.
- Data Cleaning & Transformation: Addressed data quality issues by filtering null values in critical columns, handling outliers (like negative prices indicating returns), removing duplicates, and standardizing data types (casting dates, times, numerics, booleans). Data was partitioned by year and week for faster time-based queries.
- Data Storage: The final, cleaned dataset was exported to Parquet format, which offers significantly better compression and query performance than CSV.
Key Analytics and Findings
The system was designed to provide insights into key areas of promotional performance:
1. Cannibalization Effect
This measures how promoting one item impacts the sales of similar, non-promoted items within the same category. Our analysis involved:
- Identifying promotion periods.
- Categorizing transactions into “Before,” “During,” and “After” promotion stages.
- Calculating sales changes and impact ratios.
Interesting Finding: Counterintuitively, our initial analysis often showed the highest revenue in the “Before” stage, declining during the promotion, and lowest afterwards. This suggests complexities in the data or promotion timing that warrant further investigation into how promotion periods are defined and categorized, especially when promotions overlap.
2. Promotional Effectiveness via Basket Size
Basket size (the number of items per transaction) helps reveal if promotions encourage larger purchases. We developed visualizations to:
- Compare average basket sizes for different products during their promotion periods (Before/During/After).
- Compare the basket size impact of the same product promotion across different stores or time periods.
This helps SPAR understand if a promotion is genuinely increasing overall purchase volume or just focusing spending on the discounted item.
3. Predictive Analytics (Work in Progress)
We started building predictive features:
- Promotional Sales Impact: Using Linear Regression to predict sales volume based on whether a product (or competing products in its subcategory) is on promotion. Initial results showed limitations (negative R2, high RMSE), indicating that a simple flag (on/off promotion) might be insufficient. Factors like discount depth, seasonality, and product placement likely play a significant role and require more sophisticated models (like Random Forest).
- Predicting Cannibalization: Explored using cross-price elasticity of demand within subcategories. Challenges included the vast number of product pairs even within subcategories and the need for longer time-series data to train robust models effectively.
4. User Interface
A basic UI allows users to select categories and subcategories, triggering the relevant analysis and visualizations, making the insights accessible to different teams.
Discussion: Achievements, Limitations, and Future Directions
Achievements:
- Successfully built a scalable system using Spark to process large retail datasets.
- Developed analytics for key metrics like cannibalization and basket size.
- Provided initial predictive capabilities and a basic UI for exploration.
Limitations & Challenges:
- Data Environment: Reliance on Google Drive needs transitioning to robust cloud storage (AWS S3, GCS) for production.
- Data Cleaning: Assumptions made about valid data ranges need refinement; more sophisticated outlier detection could be beneficial. Handling of nulls (removal vs. imputation) is a trade-off.
- Analysis Complexity: Overlapping promotions make attributing changes solely to one promotion difficult. The unexpected revenue patterns in the cannibalization analysis highlight the need to refine period definition logic.
- Predictive Models: Current models are preliminary. Incorporating more features (discount depth, seasonality, external data like weather/competitor pricing) and exploring advanced models (Random Forest, TCNs) are necessary next steps.
- UI Efficiency: Generating category/subcategory lists on-the-fly is slow; pre-computation is needed.
Future Directions:
- Enhance Models: Implement more robust predictive models (Random Forest, potentially deep learning like TCNs).
- Incorporate More Data: Integrate external data (weather, competitor pricing, holidays) and potentially customer-specific data (via SPAR Scankaart).
- Refine Analytics: Improve promotion period identification logic, expand basket analysis to include value, and conduct deeper category-level analysis.
- Improve UI: Optimize performance and add features for selecting different analysis types.
- Cloud Integration: Migrate storage and potentially compute to a cloud platform for true production readiness.
Conclusion
Analyzing retail promotions at scale is complex but crucial for optimizing strategy and maximizing revenue. This project demonstrates how a well-designed big data system, leveraging tools like Apache Spark, can transform massive datasets into valuable insights for a major retailer like SPAR. While challenges remain and models require refinement, the foundation is laid for a powerful analytics platform that can drive more effective, data-driven decision-making in the competitive retail landscape.